Prometheus
# Prometheus
# Prometheus安装
官网下载安装包 https://prometheus.io/download/

解压
创建文件夹用来存放数据

创建Systemd服务启动prometheus
vim /etc/systemd/system/prometheus.service[Unit] Description=Prometheus [Service] ExecStart=/opt/module/prometheus-2.37.0/prometheus --config.file=/opt/module/prometheus-2.37.0/prometheus.yml --storage.tsdb.path=/opt/module/prometheus-2.37.0/data Restart=on-failure [Install] WantedBy=multi-user.target1
2
3
4
5
6
7刷新:
systemctl daemon-reload启动 | 状态 | 使能
systemctl start prometheus
systemctl status prometheus
systemctl enable prometheus
1
2
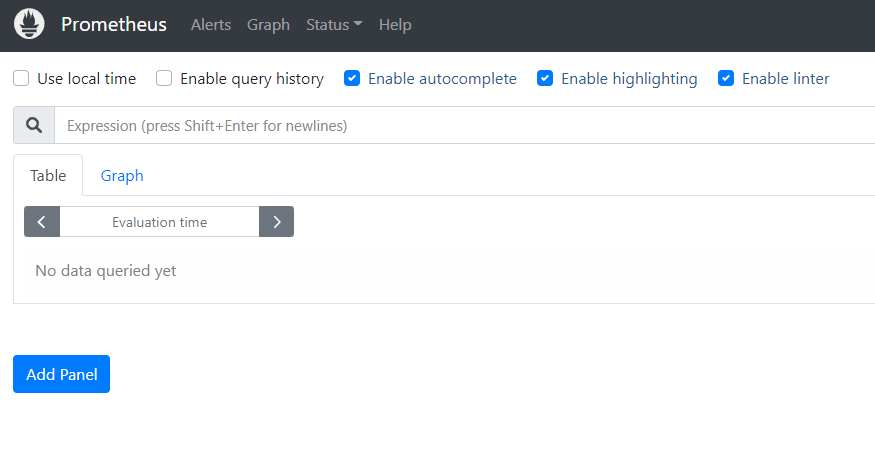
3访问服务
http://192.168.111.11:9090/
# grafana 安装
下载安装
wget https://dl.grafana.com/enterprise/release/grafana-enterprise-9.1.1-1.x86_64.rpm

sudo yum install grafana-enterprise-9.1.1-1.x86_64.rpm

systemctl enable grafana-server.service

systemctl start grafana-server.service
1
2
3
4
5
6
7登录
admin/admin
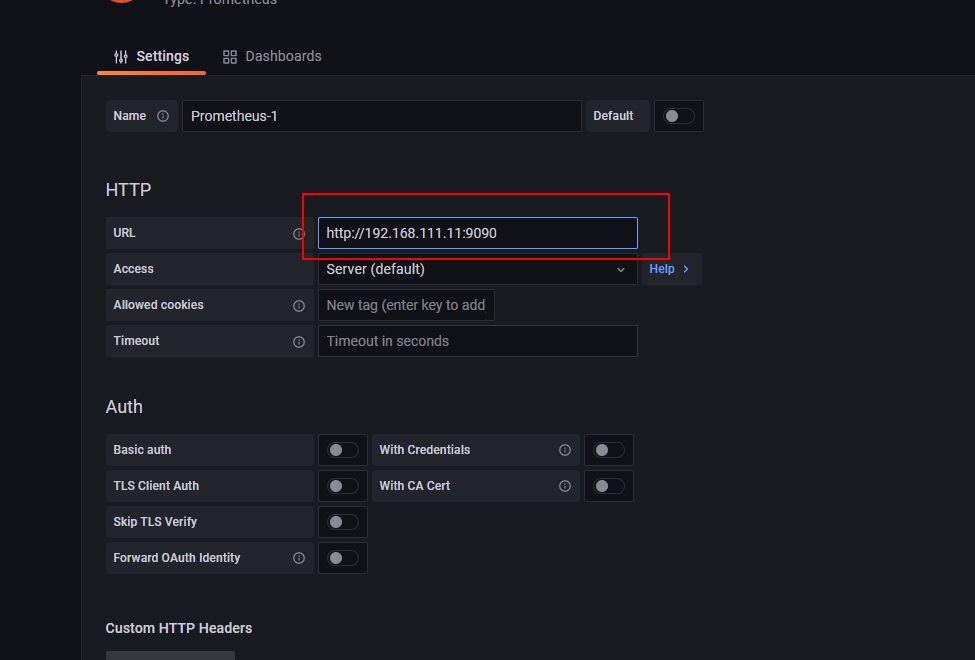
# grafana接入Prometheus数据源

# 报警模块安装
下载安装包
https://prometheus.io/download/#alertmanager1解压
创建Systemd服务启动报警模块
vim /etc/systemd/system/alertmanager.service[Unit] Description=alertmanager System [Service] ExecStart=/opt/module/alertmanager-0.24.0/alertmanager --config.file=/opt/module/alertmanager-0.24.0/alertmanager.yml -- Restart=on-failure [Install] WantedBy=multi-user.target1
2
3
4
5
6
7systemctl enable alertmanager.service启动
systemctl start alertmanager.service1访问web界面
http://192.168.111.11:9093/
# 主机监控
# node_exporter安装
依赖下载
https://prometheus.io/download/#node_exporter1解压
创建Systemd服务启动node_exporter模块
vim /etc/systemd/system/node_exporter.service[Unit] Description=node_exporter [Service] ExecStart=/opt/module/node_exporter-1.4.0/node_exporter --log.level=error ExecStop=/usr/bin/killall node_exporter [Install] WantedBy=default.target1
2
3
4
5
6
7systemctl enable node_exporter.service启动
systemctl start node_exporter.service1配置prometheus
/opt/module/prometheus-2.37.0/prometheus.yml- job_name: "node_localhost_exporter" static_configs: - targets: ["localhost:9100"]1
2
3
4重启prometheus
systemctl restart prometheus.service1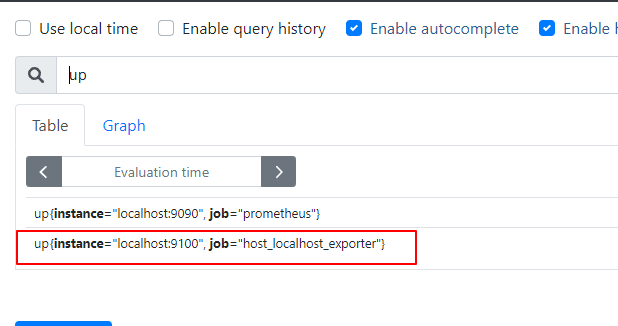
# 使用grafana 展示信息
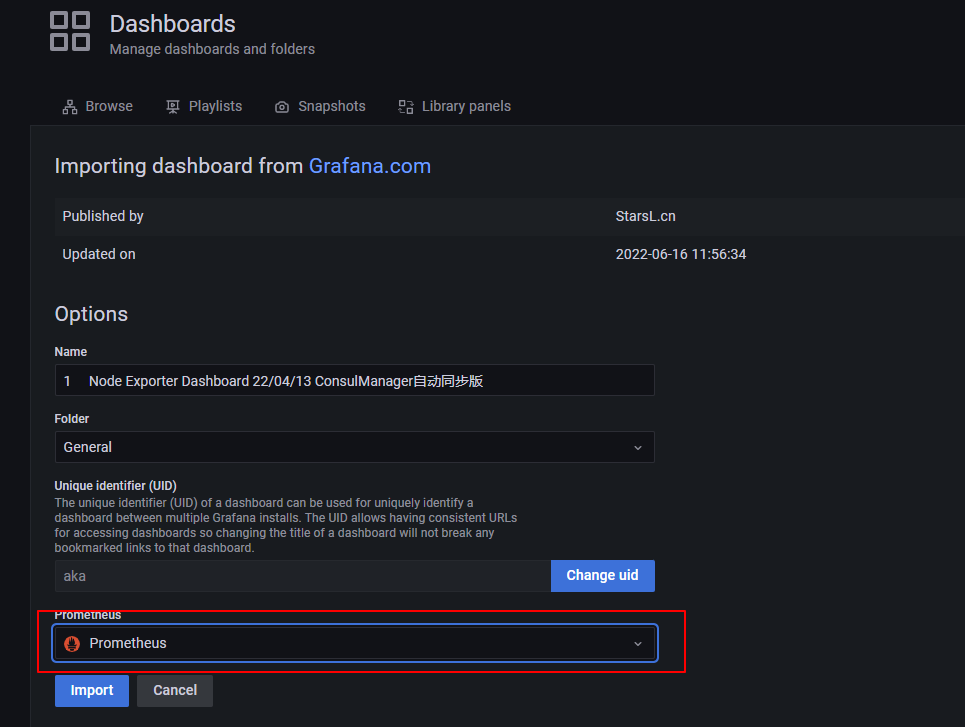
导入

输入编号使用官方提供模板
8919
选择Prometheus作为数据源
查看节点信息

# MySQL监控
# mysqld exporter安装
下载依赖
https://prometheus.io/download/#mysqld_exporter
解压
创建Systemd服务启动mysqld _exporter模块
vim /etc/systemd/system/mysqld_exporter.service[Unit] Description=Prometheus MySQL Exporter After=network.target User=prometheus Group=prometheus [Service] Type=simple Restart=always ExecStart=/opt/module/mysqld_exporter-0.14.0/mysqld_exporter \ --config.my-cnf=/opt/module/mysqld_exporter-0.14.0/.my.cnf \ --collect.global_status \ --collect.info_schema.innodb_metrics \ --collect.auto_increment.columns \ --collect.info_schema.processlist \ --collect.binlog_size \ --collect.info_schema.tablestats \ --collect.global_variables \ --collect.info_schema.query_response_time \ --collect.info_schema.userstats \ --collect.info_schema.tables \ --collect.perf_schema.tablelocks \ --collect.perf_schema.file_events \ --collect.perf_schema.eventswaits \ --collect.perf_schema.indexiowaits \ --collect.perf_schema.tableiowaits \ --collect.slave_status \ --web.listen-address=0.0.0.0:9104 [Install] WantedBy=multi-user.target1
2
3
4
5
6
7
8
9
10
11
12
13
14
15
16
17
18
19
20
21
22
23
24
25
26
27
28
29
30
31systemctl enable mysqld_exporter.service创建
.my.cnf文件用来存放mysql认证信息vim .my.cnf[client] host=192.168.111.10 port=3306 user=root password=xxxxxxx socket=/usr/local/mysql57/mysql.sock1
2
3
4
5
6prometheus添加mysql监控
  - job_name: "mysql_test_10_exporter"

    static_configs:
      - targets: ["localhost:9104"]
1
2
3
4启动mysqld_exporter
systemctl start mysqld_exporter.service1重启prometheus
systemctl restart prometheus.service1curl获取mysql监控信息
curl http://127.0.0.1:9104/metrics1prometheus界面
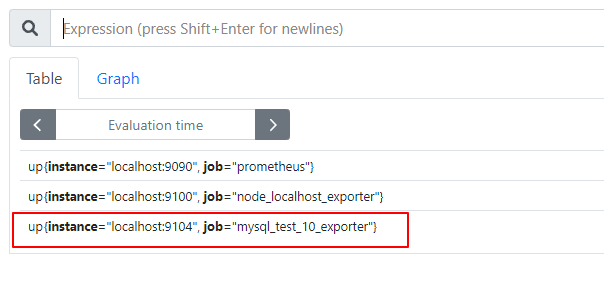
# 使用grafana 展示信息
导入
输入编号使用官方提供模板
7362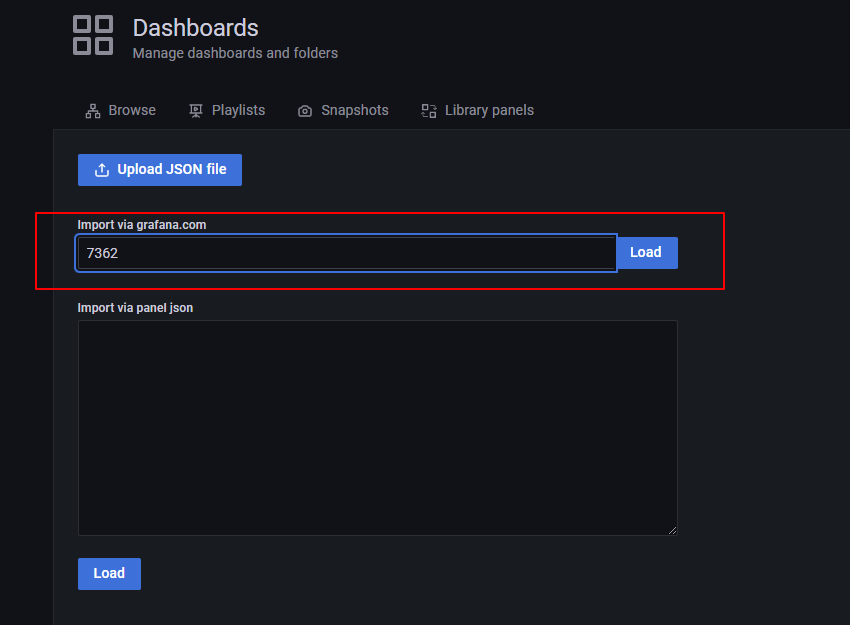
选择Prometheus作为数据源
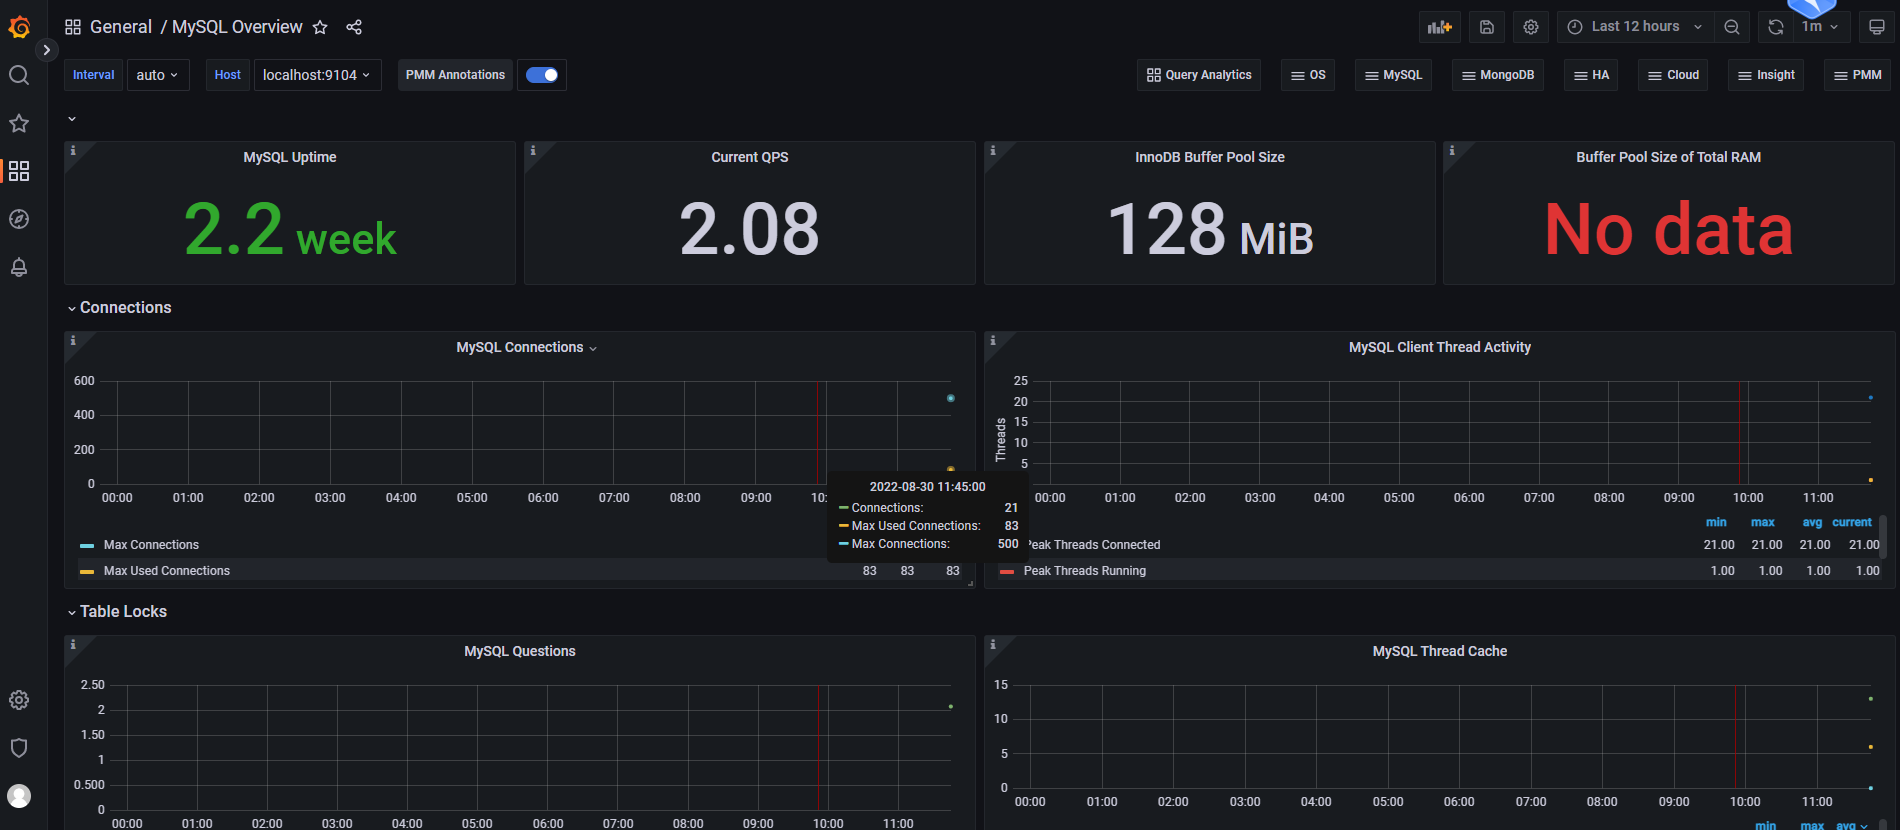
效果
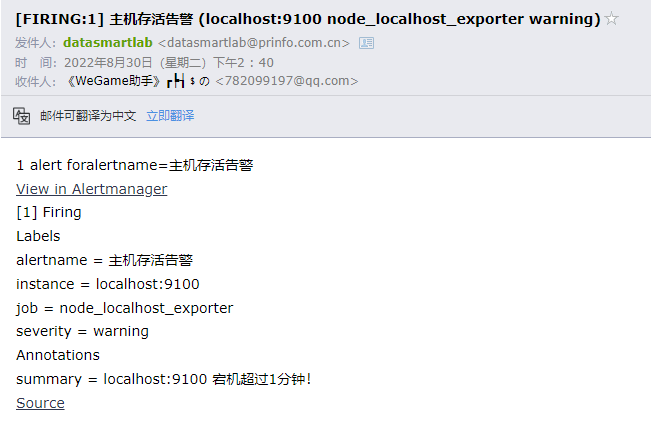
# 邮件告警
# 采用系统自带邮件模板
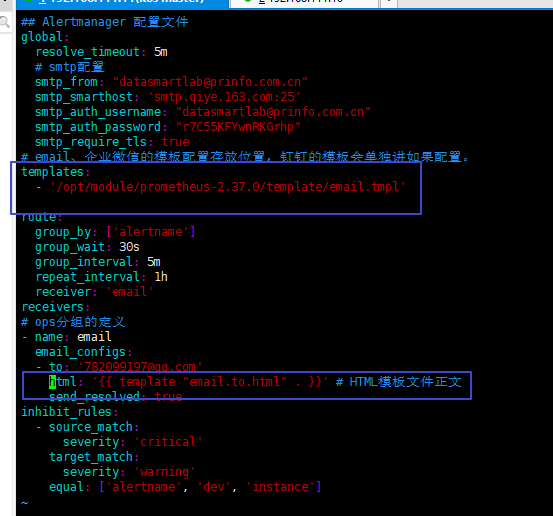
修改
alertmanager.yml文件## Alertmanager 配置文件 global: resolve_timeout: 5m # smtp配置 smtp_from: "datasmartlab@prinfo.com.cn" smtp_smarthost: 'smtp.qiye.163.com:25' smtp_auth_username: "datasmartlab@prinfo.com.cn" smtp_auth_password: "xxx" smtp_require_tls: true # email、企业微信的模板配置存放位置,钉钉的模板会单独讲如果配置。 #templates: #- '/data/alertmanager/templates/*.tmpl' route: group_by: ['alertname'] group_wait: 30s group_interval: 5m repeat_interval: 1h receiver: 'email' receivers: # ops分组的定义 - name: email email_configs: - to: '782099197@qq.com' send_resolved: true inhibit_rules: - source_match: severity: 'critical' target_match: severity: 'warning' equal: ['alertname', 'dev', 'instance']1
2
3
4
5
6
7
8
9
10
11
12
13
14
15
16
17
18
19
20
21
22
23
24
25
26
27
28
29
30
31进入prometheus,放开报警功能alertmanager需要改成服务器的ip

进入prometheus,添加报警规则
指定报警规则文件路径

创建文件夹并创建规则文件
mkdir rules1创建规则文件,只要.yml结尾即可
vim host_test_11_monitor.ymlgroups: - name: 主机存活告警 # 命名 rules: - alert: 主机存活告警 # 命名 expr: up == 0 # 表达式,分析指标判定告警 for: 60s # 触发告警持续时间 labels: # 自定义告警标签 severity: warning annotations: # 告警内容注释,根据需要制定 summary: "{{ $labels.instance }} 宕机超过1分钟!"1
2
3
4
5
6
7
8
9
10校验文件
./promtool check config ./prometheus.ymlChecking ./prometheus.yml SUCCESS: 1 rule files found SUCCESS: ./prometheus.yml is valid prometheus config file syntax Checking rules/host_test_11_monitor.yml SUCCESS: 1 rules found1
2
3
4
5
6
测试
将本机监测node_exporter停止
systemctl stop node_exporter.service1查看prometheus界面
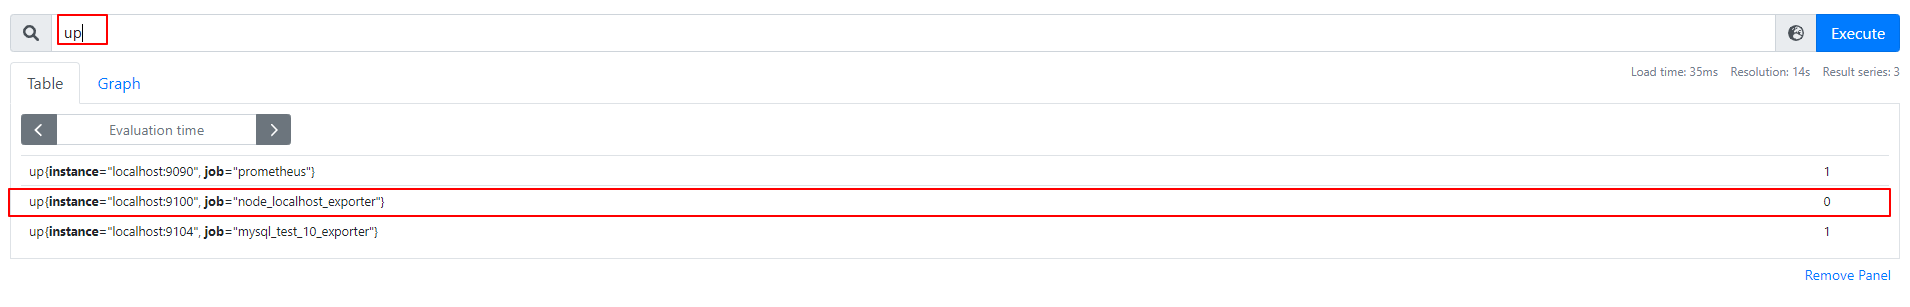
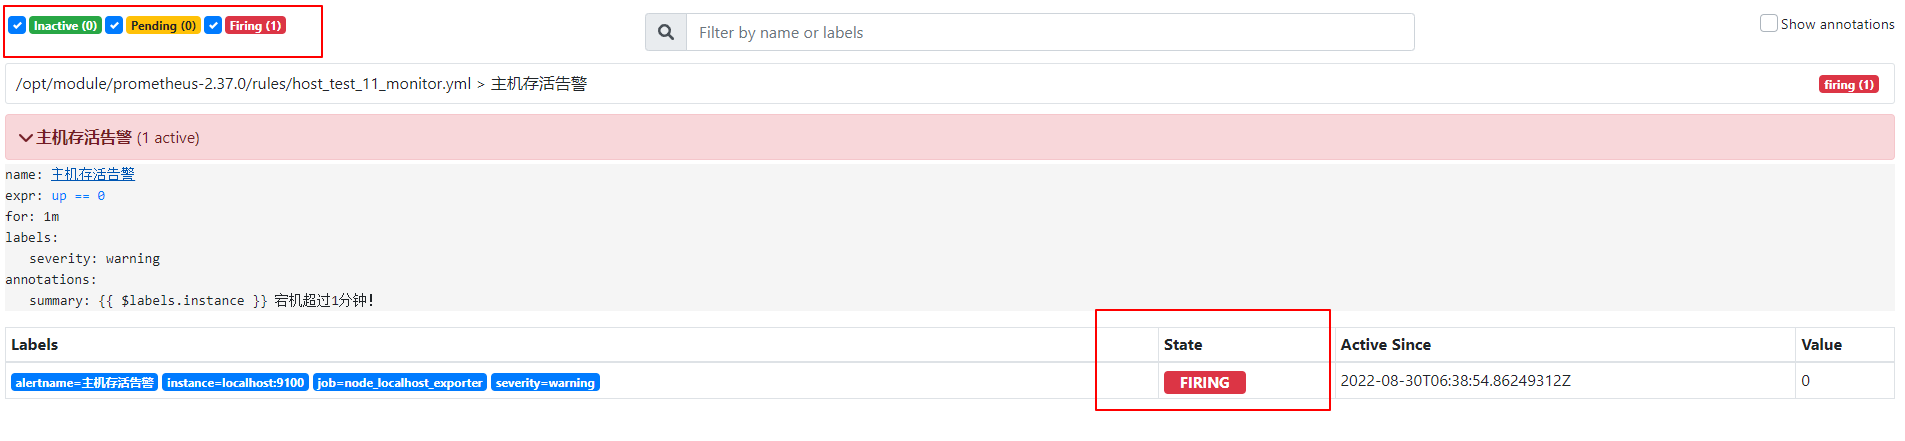
一分钟后
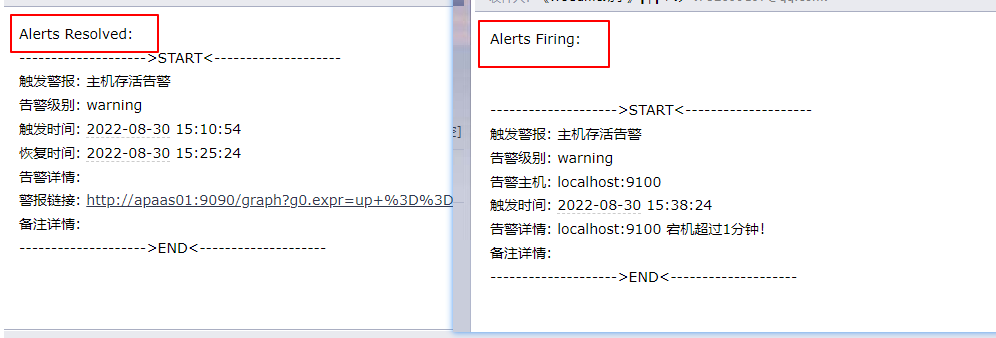
# 自定义邮件模板
创建邮件模板
在prometheus中添加文件夹template用来存放模板
mkdir template1创建email.tmpl文件,并添加文件配置
  {{ define "email.to.html" }}
  {{ if gt (len .Alerts.Firing) 0 -}}
  Alerts Firing: <br>
  <br>
  <br>
  {{ range .Alerts }}
 -------------------->START<-------------------- <br>
  触发警报: {{ .Labels.alertname }} <br>
  告警级别: {{ .Labels.severity }} <br>
  告警主机: {{ .Labels.instance }} <br>
  触发时间: {{ (.StartsAt.Add 28800e9).Format "2006-01-02 15:04:05" }} <br>
  告警详情: {{ .Annotations.summary }} <br>
  备注详情: {{ .Annotations.runbook_url }} <br>
  -------------------->END<-------------------- <br>
  <br>
  <br>
  {{- end }}
  {{- end }}
  {{ if gt (len .Alerts.Resolved) 0 -}}
  Alerts Resolved: <br>
  {{ range .Alerts }}
  -------------------->START<-------------------- <br>
  触发警报: {{ .Labels.alertname }} <br>
  告警级别: {{ .Labels.severity }} <br>
  告警主机: {{ .Labels.instance }} <br>
  触发时间: {{ (.StartsAt.Add 28800e9).Format "2006-01-02 15:04:05" }} <br>
  恢复时间: {{ (.EndsAt.Add 28800e9).Format "2006-01-02 15:04:05" }} <br>
  告警详情: {{ .Annotations.summary }} <br>
  备注详情: {{ .Annotations.runbook_url }} <br>
  -------------------->END<-------------------- <br>
  <br>
  <br>
  {{- end }}
  {{- end }}
  {{- end }}
1
2
3
4
5
6
7
8
9
10
11
12
13
14
15
16
17
18
19
20
21
22
23
24
25
26
27
28
29
30
31
32
33
34
35
添加自定义模板配置
修改alertmanage.yml
效果
# Docker监控
# 容器安装
需要在监控的服务器上运行cAdvisor
docker run \
--volume=/:/rootfs:ro \
--volume=/var/run:/var/run:ro \--volume=/sys:/sys:ro \
--volume=/var/lib/docker/:/var/lib/docker:ro \
--volume=/dev/disk/:/dev/disk:ro \
--publish=8080:8080 \
--detach=true \
--name=cadvisor-xinyue-edgeservice \
--net=cloudservice \
google/cadvisor:latest
1
2
3
4
5
6
7
8
9
10配置Promethus
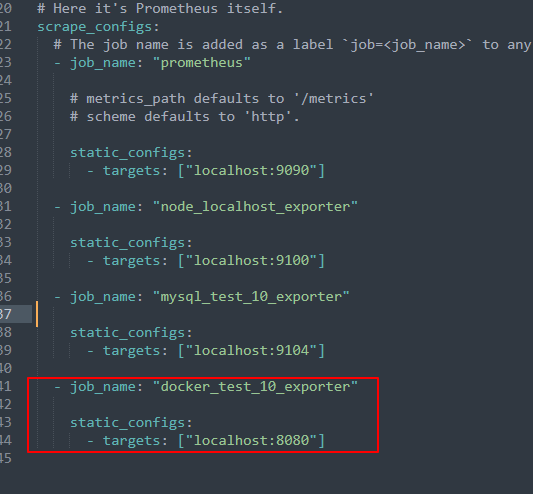
重启promethus服务
systemctl restart promethus.service1
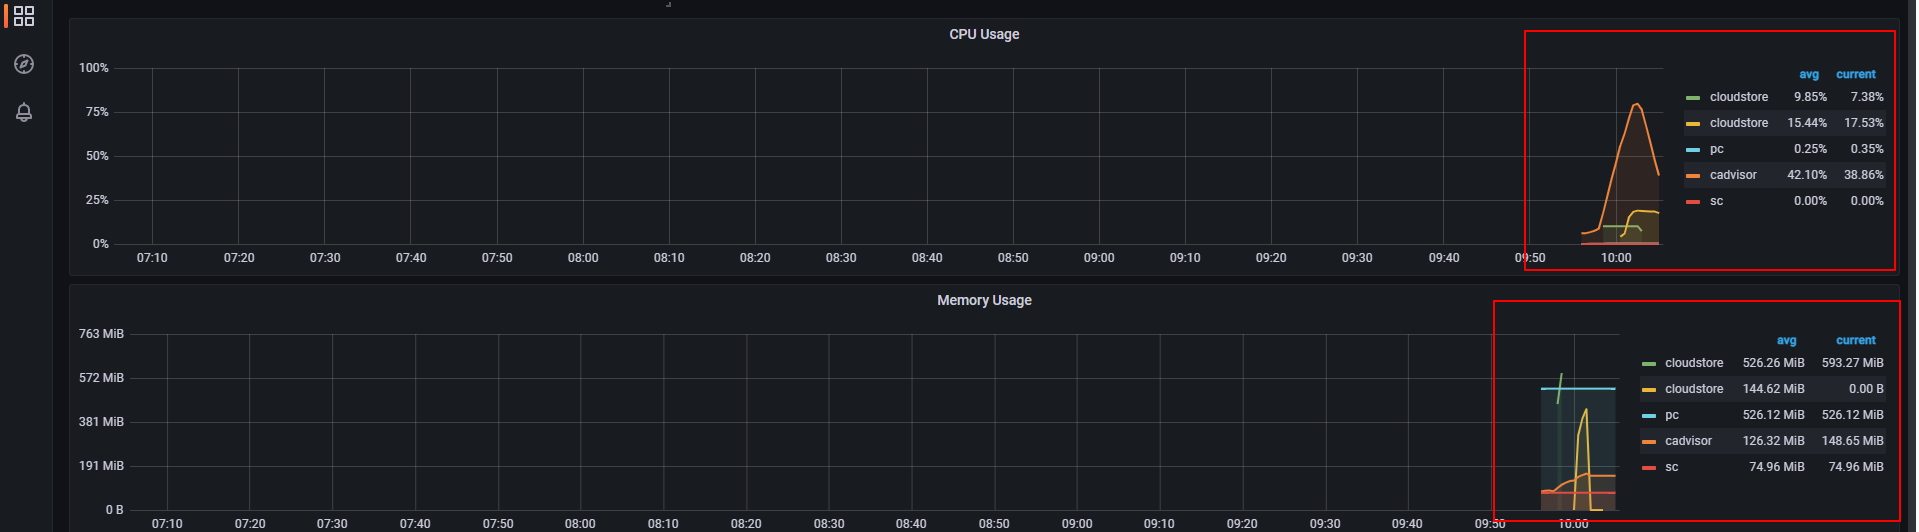
# grafana接入
导入
输入编号使用官方提供模板
193
选择Prometheus作为数据源
效果
# pushgateway
Push Gateway:短期存储指标数据。主要用于临时性的任务,各个目标主机可以上报数据到pushgateway,,然后prometheus server统一从pushgateway拉取数据
# 安装
下载https://prometheus.io/download/#pushgateway
解压
创建Systemd服务启动pushgateway模块
vim /etc/systemd/system/pushgateway.service[Unit] Description=prometheus After=network.target [Service] User=prometheus # 用户,可去除 Group=prometheus # 组, 可去除 WorkingDirectory=/opt/module/pushgateway-1.4.3 ExecStart=/opt/module/pushgateway-1.4.3/pushgateway \ --web.enable-admin-api \ --persistence.file="pushfile.txt" \ --persistence.interval=10m [Install] WantedBy=multi-user.target1
2
3
4
5
6
7
8
9
10
11
12
13
14systemctl enable pushgateway.service启动
systemctl start pushgateway.service1Prometheus配置JOB
- job_name: 'pushgateway'
        honor_labels: true
        static_configs:
          - targets: ['localhost:9091']
1
2
3
4
# java客户端
依赖
<dependency>
    <groupId>io.prometheus</groupId>
    <artifactId>simpleclient_pushgateway</artifactId>
    <version>0.16.0</version>
</dependency>
1
2
3
4
5demo
try{
    String url = "192.168.111.11:9091";
    CollectorRegistry registry = new CollectorRegistry();
    Gauge guage = Gauge.build("my_custom_metric", "This is my custom metric.").labelNames("app", "date").create();
    String date = new SimpleDateFormat("yyyy-mm-dd HH:mm:ss").format(new Date());
    guage.labels("my-pushgateway-test-0", date).set(25);
    guage.labels("my-pushgateway-test-1", date).dec();
    guage.labels("my-pushgateway-test-2", date).dec(2);
    guage.labels("my-pushgateway-test-3", date).inc();
    guage.labels("my-pushgateway-test-4", date).inc(5);
    guage.register(registry);
    PushGateway pg = new PushGateway(url);
    Map<String, String> groupingKey = new HashMap<String, String>();
    groupingKey.put("instance", "my_instance");
    pg.pushAdd(registry, "my_job", groupingKey);
} catch (Exception e){
    e.printStackTrace();
}
1
2
3
4
5
6
7
8
9
10
11
12
13
14
15
16
17
18